Modernization
Lambda Redis SlowLog to CW Logs Module on Terraform
Streamline Redis performance with StratusGrid's Lambda module, automating slow log analysis to AWS CloudWatch for optimal efficiency.
Discover AWS CloudWatch Logs Insights for efficient and streamlined log analysis. This is a modern solution to the challenges of analyzing extensive log data.

You just received a report that an application is experiencing issues. You immediately attempt to locate the logs. When you find them, you are met with over a terabyte of log data, and your previously renowned find and grep skills are outmatched.
Luckily, most of us are using centralized logging by now and no longer have to go on this sort of server-side scavenger hunt. For those of us in AWS, we primarily use CloudWatch for housing centralized logs.
Many AWS services automatically send logs or can easily be configured to deliver their logs to CloudWatch. Here is a list of services that commonly deliver their logs to CloudWatch:
But Tyler, how do you search and analyze log data effectively once you have all the logs inside CloudWatch?
CloudWatch Logs Insights is a feature of CloudWatch that can help with this. Out of the box, it enables you to do the following:
Search and analyze log data located in Amazon CloudWatch Logs.
Discover log fields automatically for appropriately formatted JSON-based logs.
Save and share queries within your account for reuse.
Add query results to dashboards for improved observability and monitoring.
This blog post will guide you through utilizing CloudWatch Logs Insights so you can restore your log analysis skills to glory in the modern age.
For this guide, I chose to generate a dataset from scratch for those who might be following along without logs in CloudWatch Logs yet.
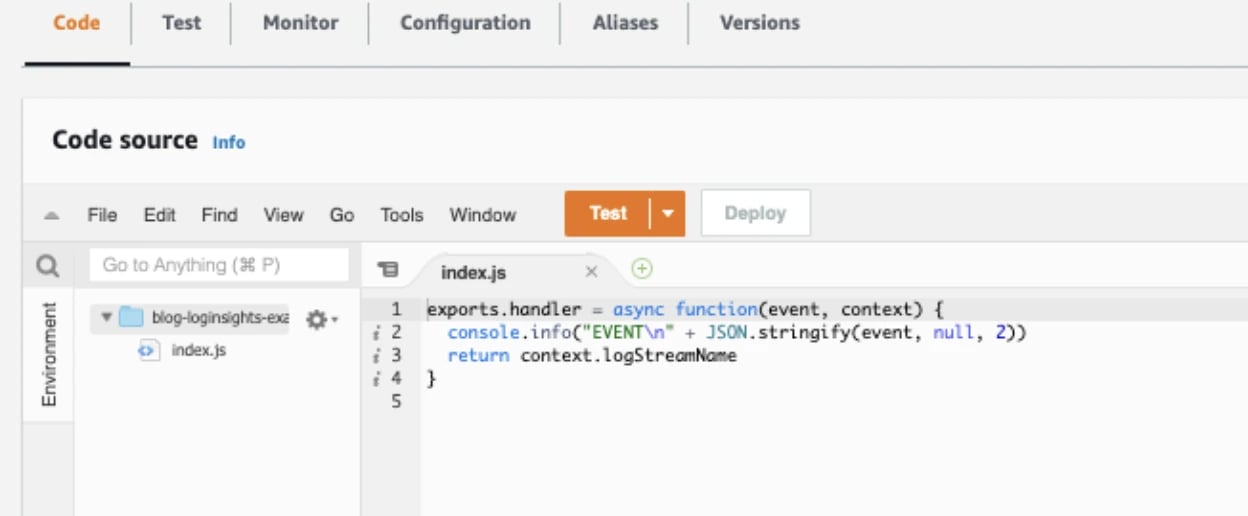
To do this, we need to create a Lambda function that writes all the events it receives to a CloudWatch log group. I used a Node.js Lambda for this and authored it from scratch using the default settings.
Once the Lambda was created, I replaced the default index.js with the following:
exports.handler = async function(event, context) {
  console.info("EVENT\n" + JSON.stringify(event, null, 2))
  return context.logStreamName
}
For the sake of simplicity, we will invoke this lambda function using the “Test” feature in the Lambda console along with the JSON event template called “apigateway-aws-proxy.” Create the Lambda test event:
.webp?width=1244&height=448&name=CloudWatch%20Log%20Insights-%20How%20to%20Analyze%20AWS%20Log%20Data1%20(1).webp)
Once that event has been created and saved, you can invoke your Lambda function by selecting “Test” which will then start populating the logs with data from these invocations:
We should have some data at this point. Let’s navigate to the CloudWatch console and select Logs Insights from the left sidebar:
.webp?width=382&height=530&name=CloudWatch%20Log%20Insights-%20How%20to%20Analyze%20AWS%20Log%20Data%2c%20(1).webp)
Select the log groups that you wish to analyze and perform the “Run Query” using the default query provided:
.webp?width=1260&height=744&name=CloudWatch%20Log%20Insights-%20How%20to%20Analyze%20AWS%20Log%20Data4%20(1).webp)
This query should return very quickly with the last 20 log entries for the log group/groups specified within the timeframe selected. As you can see, the limit is currently set to 20, but this can be increased all the way up to 10,000. You may also notice that the query language used is unique to CloudWatch Logs Insights. To learn more about the syntax and query language itself, I highly recommend checking out the following resources:
Now that you understand the basics let’s dive into the features that make this tool one you want in your toolbox.
The first major feature is the ability to automatically discover fields in logs from many AWS services and any application or custom log that emits log events as JSON. If you navigate to the right side of the screen and select “Fields”, you can see this in action:
.webp?width=702&height=1154&name=CloudWatch%20Log%20Insights-%20How%20to%20Analyze%20AWS%20Log%20Data5%20(1).webp)
CloudWatch Logs Insights inserts the @ symbol at the start of the field that it generates. The other fields listed are fields that it discovered within the logs. We can directly query fields from this list or use the parse command to extract and create ephemeral fields.
For example, if we wanted to get a count of the number of CloudFront viewers by country:
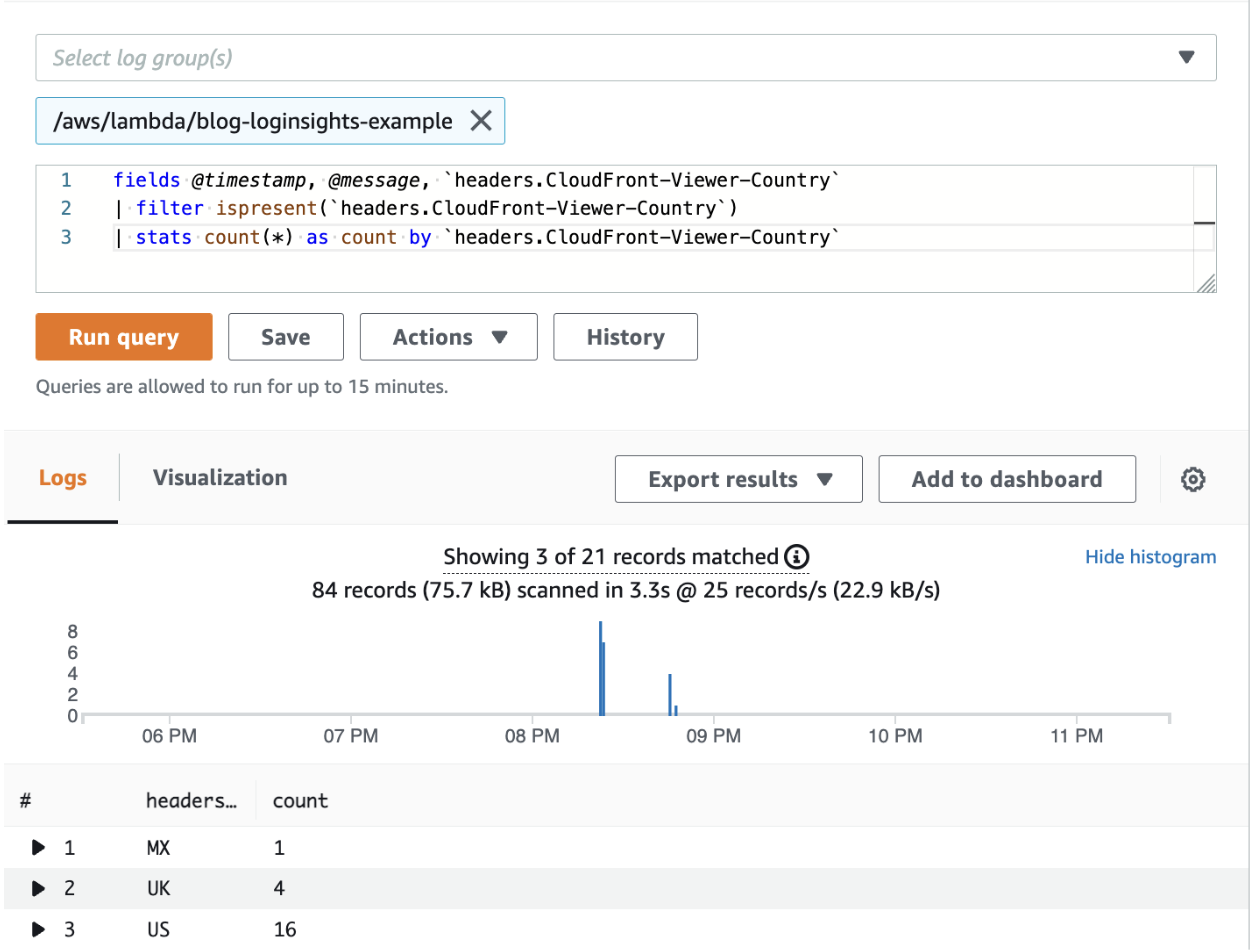
Notice how we filter the logs using the ispresent() function here. This is because the field header.CloudFront-Viewer-Country is only present in about 25 percent of the logs. We can determine this by examining the percentage next to the field in the field tab:
.webp?width=1010&height=1392&name=CloudWatch%20Log%20Insights-%20How%20to%20Analyze%20AWS%20Log%20Data.%2c%20(1).webp)
As you can see, developing a set of queries around your logs could provide you with a wealth of knowledge and data.
Once you have developed a query that provides you with valuable insights, you may wish to retain it for future use. CloudWatch Logs Insights offers users the option to save queries. Others can reuse saved queries within the account. This is great because it allows us to bake these queries into our runbooks and utilize them in troubleshooting scenarios. Queries are saved directly in the console in either existing folders or new folders. I typically recommend building the following path to your queries ${AWS-Service}/${Service-Name}/${QueryName}:
.webp?width=1000&height=812&name=CloudWatch%20Log%20Insights-%20How%20to%20Analyze%20AWS%20Log%20Data9%20(1).webp)
If you navigate to the right side of the screen and select “Queries”, you can see these folders:
.webp?width=1000&height=786&name=CloudWatch%20Log%20Insights-%20How%20to%20Analyze%20AWS%20Log%20Data11%20(1).webp)
The path structure recommended above remains easy to navigate as you expand this catalog to include more queries.
CloudWatch Logs Insights queries can also be added to CloudWatch dashboards providing your teams with the ability to quickly visualize the log data at any time. Run a query, then select “Add to Dashboard”; you can select the widget and get a preview of what the query will look like on the dashboard:
.webp?width=1002&height=498&name=CloudWatch%20Log%20Insights-%20How%20to%20Analyze%20AWS%20Log%20Data112%20(1).webp)
Queries added to a dashboard run every time the dashboard loads or refreshes. This real-time log data adds an additional layer of depth to your observability and offers a seamless integration.
When utilizing modern technologies, we should also look to utilize modern patterns and tools that integrate seamlessly with them. Most of us using AWS are utilizing CloudWatch Logs; therefore, we should leverage the abilities of CloudWatch Logs Insights. Thus, I will end with the following notes:
CloudWatch Logs Insights only works with CloudWatch log groups - get your logs inside of CloudWatch and off the servers!
Field auto-discovery only works for structured JSON logs - standardize your logging format and leverage the feature!
Save the queries that you build - build a knowledge base that empowers others!
Add queries to dashboards - enrich your observability with log data!
I hope this guide has been helpful for you and that your 2:00 AMs are blessed with sleep. For more information and guidance related to AWS and DevOps, connect with me on LinkedIn!
Unleash the power of advanced log analysis tools to efficiently sift through extensive log data, gaining actionable insights and enhancing your AWS environment's observability. Whether you're troubleshooting an application or monitoring system performance, our expertise in CloudWatch Logs Insights equips you with the knowledge to leverage this powerful tool to its fullest potential.
Contact us today to elevate your log analysis strategy and harness the full capabilities of AWS CloudWatch for a more insightful and proactive approach to your cloud resources.
BONUS: Download Your FinOps Guide to Effective Cloud Cost Optimization Here ⤵️
.webp?width=1307&height=448&name=FinOps-Guide-Downloadable%20(2).webp)
Streamline Redis performance with StratusGrid's Lambda module, automating slow log analysis to AWS CloudWatch for optimal efficiency.
This article provides a detailed walkthrough, from understanding AWS access logs to efficiently parsing and analyzing them using Athena’s SQL syntax.
Explore StratusGrid's innovative IT solutions for the logistics sector. Enhance efficiency and scalability in your logistics operations with our...